Your tests stay Playwright, Selenium and pytest. We don't replace them. We make them enterprise-ready, and you own everything: code, evidence and history.
One failed test. Everything it left on your disk.
A real run, not a mock-up: TC92 on 2026-09-30, headless, in Chromium, Firefox and WebKit. It opens example.com, follows Learn more to IANA and expects the heading to read Example Domain. The page says Example Domains. These are the Chromium run's files, their real sizes and what is inside each one.
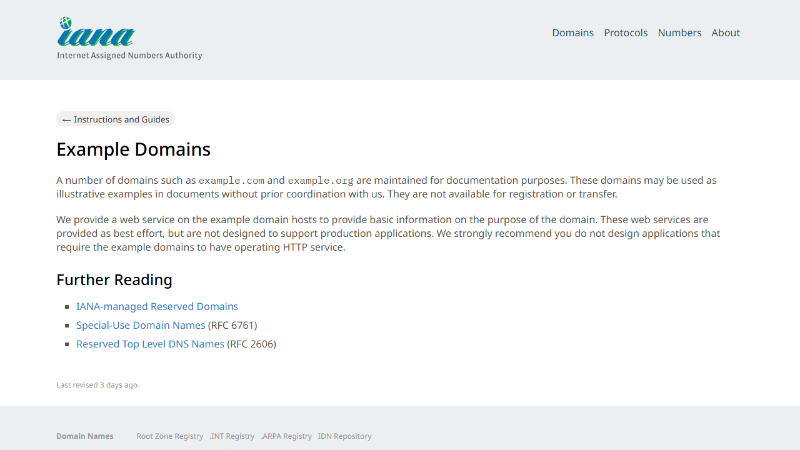
Line 23 of TC92_Iana_heading.js expects the heading to read Example Domain. IANA's page says Example Domains: in 10000 ms the locator resolved 23 times and read the plural every time. BREACHED, on all three engines. Here is the frame it failed on, and every file it wrote.
https://www.iana.org/help/example-domains
screenshot.png · 89.8 kB · one viewport screenshot of the final frame, 1280×720: what a user would have seen when the check ran
In the Evidence Locker the same record opens on five tabs:
ReportMetadataTelemetryRaw LogAI Analysis
report.md5.3 kB
The forensic report, in Markdown: it reads without the Studio.
Incident summary
Root cause analysis
Network telemetry
Failure timeline
Historical stability
Self-healing log
Evidence artifacts
Performance budget
Lazy-loading audit
Use it to file a ticket: the Incident summary names the test, browser, page and business impact, and the Root cause analysis the failed check, selector, expected and received values and the source line.
metadata.json2.2 kB
32 fields, machine-readable. A few of them, as written:
Use it to filter failures with a script instead of a Markdown parser. It is also the file the chain of custody seals: a folder with a metadata.json is a record.
raw-data.json5.1 kB
The raw log: every console line, network error, security issue and page error of the run, and the performance samples.
Use it to see what the page did around the failure. A FLAKY or AUTO_RECOVER pass keeps the failed attempt's raw-data.json, so a retry that hid the failure still leaves its log.
Telemetrymeasured
Measured at the end of the test, against your budgets. The bar is the measurement over its budget.
LCP992 / 2500 ms
FCP992 / 1800 ms
CLS0.0295 / 0.1
TTFB727 / 800 ms
TBT0 / 200 ms
DOM114 / 1500 nodes
Heap5 / 50 MB
INPnot measured
All within budget, and the report flags TTFB as close to it. INP reads not measured, never a pass: nothing was clicked or typed on the page it measured. The lazy-loading audit scored the page 85 of 100, grade B: one image without a width and height.
Use it to tell a slow page from a wrong assertion.
video.webm428.8 kB
0:08 of 0:16
The whole session, 16.6 seconds: example.com, the click on Learn more, then IANA's page while the check retried. Kept because the run was BREACHED, and it plays in the Evidence Locker. A real failure keeps its video: BREACHED, BREACHED_FLAKY and CHAOS_BREACHED by default, TIMEOUT and BLOCKED when you turn them on in Settings. CRASHED and UNREACHABLE are never offered, because that recording comes out broken or blank. Only Playwright web and emulated mobile runs record: a real Android phone, a Selenium run and an API test do not.
Use it to see how the page got to the failed check, step by step; the screenshot above is the last frame.
AI analysisyour AI
On by default, with your AI connected. With a local Ollama model, the default, or another provider you pick, the engine adds four headings to the report: Diagnosis, Probable cause, Impact and Recommended action. When your own AI command-line tool is on in the AI writer, it reads report.md after the run instead, for up to five failures per run, and adds a fifth heading:
Diagnosis
Classification (command-line tool only)
Probable cause
Impact
Recommended action
The classification is exactly one of APP_BUG, APP_CHANGE, TEST_AUTHORSHIP, TEST_SETUP or INFRA_FLAKY. No AI connected: no analysis, and the five files stay the same.
trace.zip is a sixth file. With Record a forensic trace on failure on, which is the default, a BREACHED folder also files a Playwright trace (DOM snapshots, screenshots and sources), opened with npx playwright show-trace trace.zip. It is not recorded on a real Android phone. TC92 ran before tracing became the default, so its folder holds the five files above.
The 14 verdicts, and what each one tells you to do next.
The verdict is in the folder's name: TC92's ends in [BREACHED]. The classifier reads a failure in a fixed order: the harness first, then a crash, a block, an unreachable host and a timeout, and only then BREACHED_FLAKY or BREACHED. So a BREACHED is a failure no environment pattern explains. Each card says whose turn it is and what that verdict files.
SECURENobody
Passed on its own: no retry, no repaired selector. Nothing to do. Filed in evidence-passed-test, the newest 5 per test and browser.
screenshot.pngmetadata.json
CHAOS_RESILIENTNobody
Passed while a fault was injected, so the app held. Filed in chaos-runs, apart from the bug reports, so chaos never skews the stability numbers.
Green, but not unassisted: the self-healer swapped a broken selector. The locator in the test is dead, and the next DOM change breaks the suite for real. Fix the locator. raw-data.json appears when a retry was needed, and it is the failed attempt's.
screenshot.pngmetadata.jsonraw-data.json
FLAKYTest or app
Failed, then a retry passed it, and nothing was repaired. That is unexplained instability in the app or the test, not a fix. Read the failed attempt's raw-data.json, then the History trend.
screenshot.pngmetadata.jsonraw-data.json
PERFORMANCE_DEGRADEDApp
Assertions passed and the page was too slow: a Web Vitals or lazy-loading budget was exceeded. Advisory until you make the check strict.
screenshot.pngmetadata.json
A11Y_VIOLATIONApp
Assertions passed, accessibility did not. metadata.json lists each axe-core rule that fired, with its impact and node count. Advisory until you make the check strict.
screenshot.pngmetadata.json
SECURITY_VIOLATIONApp
Assertions passed, the security headers did not (a missing CSP, for example). Fix the response headers. Advisory until you make the check strict.
screenshot.pngmetadata.json
BREACHEDApp
An assertion failed and no environment or harness pattern explains the error. Read Expected and Received in report.md, watch the video, then mark it Real bug or False alarm, with a reason.
Failed on the last attempt after an earlier retry: the failure itself is inconsistent. Compare the attempts before you file a bug. Its video is kept by default.
Broke under an injected fault. A resilience finding, kept apart from the functional bug reports; the report records the fault applied and the impact on the user. Retention never removes a run that broke. Its video is kept by default.
Never answered in time, which is not proof the app is broken. Check how fast the page was in Telemetry before you touch a dial: a longer limit does not hide a broken element, it fails later. Its video is off by default; turn it on in Settings, under Keep failure video for.
The host could not be reached at all: DNS or the connection failed before any page was observed. Check the URL, the network and the target's availability. Not a finding about the app. No page loaded, so its video would be blank and none is offered.
The site defended itself: a 403, a 429, a block page or a bot challenge. metadata.json names the defense when one was on screen. Not a finding about the app, and Jira never files a block. Its video is off by default; turn it on in Settings, under Keep failure video for.
The browser or the process died: a closed page, a DevTools protocol error, a dead WebDriver session. Infrastructure, not the app. Look at the machine and the driver. The recording of a dead browser comes out broken, so none is offered.
Not among the 14: CONFIG_ERROR (the harness could not start the test: a broken import, a missing .env value), SKIPPED and INTERRUPTED. None is a result about your app, so none files an evidence folder or a History row. A CONFIG_ERROR is still written in full, with a hint, to a log under .run-cache/config-errors/, so the broken test gets fixed. API tests have seven verdicts of their own: API tests.
History
Every run writes one row. The rows judge the test.
Beside the folder, each run appends a row to history/<browser>/<test>/runs.json: the last 50 runs of each test on each browser, by default. These are TC92's three rows, one per browser, as written. The same error_signature on all three says it is one error, not three.
A value the browser cannot measure is written as null, never as zero: WebKit reports no TTFB here. Row times are UTC, as the row writes them; folder names use the machine's local time, UTC−5 on this one.
perf holds LCP, FCP, CLS, TTFB, TBT, INP, long tasks, DOM size, heap, every page visited and the lazy-loading score. raw_log_ref and evidence_ref point back at the folder above.
What the engine prints from it
TC92 chromium BREACHED 13.7s
expect(locator).toHaveText(expected) failed
at TC92_Iana_heading.js:23 waiting for getByRole('heading', { level: 1 })
stability CRITICAL 0% · 0/1 runs · 1 failed in a row
# TC91, the staged demo on the home page: a BREACHED, then a TIMEOUT
stability CRITICAL 0% · 0/2 runs · 2 failed in a row
The row's duration_ms, 12291, is the test itself, as Playwright timed it, on the second of its two attempts.
The same rows feed the report's Historical stability section, the History screen's trends (Regressed, Recovered, Still broken, Slower) and the risk ranking, where nothing is called flaky below five runs.
A pass keeps little. A failure keeps everything. Old files go.
A suite that runs every night fills a disk. The engine caps every folder it writes, per test and browser, so the disk stops growing at a size you can predict. A failure still keeps what it takes to reproduce it: the error with its selector and values, the page URL, the frame, the console, network and page-error lines, the runtime and platform, and the run's context, what it was measured against. The caps are set in Settings, under Evidence & Retention.
The same files without the recording, because TIMEOUT is off by default for video: 23.9 kB for TC91's TIMEOUT, the staged demo on the home page.
A pass
screenshot.pngmetadata.json
Filed apart from the bug reports, the newest 5 per test and browser. The screenshot is what visual regression compares. A FLAKY or AUTO_RECOVER pass keeps its folder too, with the failed attempt's raw-data.json, while Keep evidence of a FLAKY / AUTO_RECOVER pass is on.
Settings · Evidence & Retention · defaults
Bug reports kept per test20NEXUS_BUGREPORT_RETAIN
Passing screenshots kept5NEXUS_PASSED_RETAIN
Keep evidence of a FLAKY / AUTO_RECOVER passonNEXUS_RECOVERED_RETAIN
Raw run history window50 runsNEXUS_HISTORY_RETAIN
Smart Monkey sessions kept10NEXUS_MONKEY_RETAIN
Run contexts kept (what each run tested against)100NEXUS_RUN_CONTEXT_RETAIN
Record failure videoonNEXUS_VIDEO_ENABLED
Keep failure video for3 verdictsNEXUS_VIDEO_VERDICTS=BREACHED,BREACHED_FLAKY,CHAOS_BREACHED
Record a forensic trace on failureonNEXUS_TRACE_ENABLED
These three lines followed TC92's run. The run's telemetry scratch files are never evidence: they go into a zip, the loose copies are deleted, and at most 2 zips of up to 7 days stay, within 500 MB. Those three limits are NEXUS_CACHE_ZIPS, NEXUS_CACHE_RETENTION_DAYS and NEXUS_CACHE_MAX_MB in .env, not fields in Settings.
In Settings, Clear cache drops the workspace's test-results and playwright-report folders and closes any browser a crashed or killed run left behind. It is refused while a patrol is running.
Workspace · Disk · the limit each folder has today
area limit today
Bug reports newest 20 runs per test and browser
Passed tests newest 5 runs per test and browser
API evidence newest 20 passing runs per test; failures kept
Chaos runs newest 20 held runs; runs that broke kept
Smart Monkey newest 10 sessions
Visual regressions newest 10 per test and checkpoint
Run context newest 100 runs
Run history newest 50 runs per test and browser
Chain of custody append-only, never trimmed
Archive no automatic limit
The Disk panel lists every folder a run writes to, biggest first, with its size, file count and oldest date, the total and the free space on the drive. A folder with no automatic limit is flagged. Clean is offered only where it is safe: the run cache, test file versions older than 14 days and Executive reports older than 30 days. It never touches evidence or the archive.
Evidence Locker · keep what matters, free the rest
Archive… copies exactly the parts you tick, Screenshot and Report ticked to start, into View → Archive. The copy sits beside the evidence folder, not inside it, so no retention sweep reaches it, and the run in the Locker is not touched.
Restore, on the Archive screen, puts a record back where it was and back into the count. If its folder was freed, the archived parts are written back into the Evidence Locker. A False alarm verdict still keeps it out of the count.
Free disk sends a folder to the recycle bin. Where the record is sealed, the engine writes the disposition first, so nexus verify reports PURGED, not TAMPERED. Retention does the same when it removes the oldest folder, and the ledger keeps proving what the folder hashed to, who removed it and when. Sealing is opt-in: until the first Real bug or False alarm verdict, or nexus verify --seal, the Locker reads UNVERIFIED.
See what your own failures leave behind.
Free for 30 days, with every feature, on your machines. No card needed.
 Nexus Studio